Memoryze is a great tool for memory analysis, but what makes it even stronger is that it can be integrated with other tools to help with incident response. These other tools can be leveraged to bring Memoryze's capabilities to remote hosts. If your organization has not deployed or piloted MANDIANT Intelligent Response (MIR), you can use Encase Enterprise Edition (EEE) to gain access to remote memory. Just like with MIR, using EEE you are able to collect volatile data with "snapshots" and also have the ability to access memory on a remote system. Once you have access to the remote memory object is when Memoryze comes in handy. The ability to access this remote memory object with EEE is how the "MemScript" was born. The MemScript is an EnScript that integrates a couple of programs to automate memory analysis with EnCase. First, MemScript is integrated with Memoryze. MemScript accesses the memory entry and uses Memoryze to do the analysis. Secondly, MemScript then takes the results from Memoryze's analysis and launches MANDIANT's Audit Viewer. Using MemScript is easy and even easier to setup. The first step in using MemScript is having the tools it integrates. You will need the following tools.
- EnCase
- Memoryze
- Audit Viewer
Note: Please make sure you have updated to Memoryze 1.2.18.0 and Audit Viewer 1.0.0.7 released this week.
Audit Viewer does require Python and a Python GUI library so getting these installed is also required to use MemScript. These requirements can be found at the following links:
Once all the tools are on the system, you can begin the analysis by adding the memory entry to a case. To add the memory object to a case go to "Add Device". In this window, check the box for Physical Memory. At this point, you should have a window, which is illustrated in Figure 1.
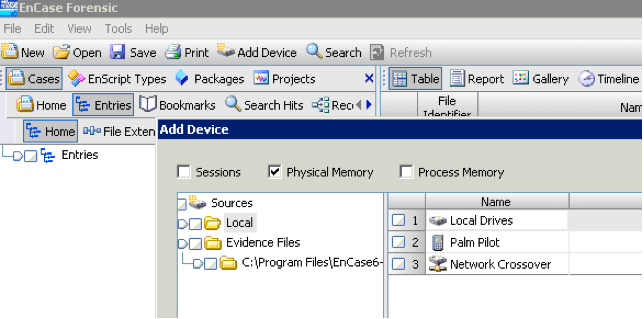
Figure 1: Enabling the memory object.
If your windows are similar to the ones above, double click on the Local Drives in the right hand table (it would be a remote machine with EEE). The next window will show whether you have access to the systems memory. If you do have access, the window in Figure 2 should appear.
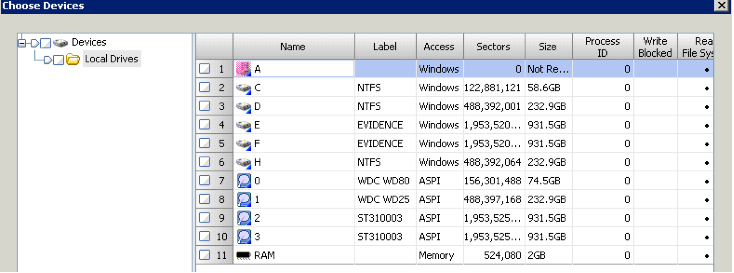
Figure 2: Adding the RAM device.
At this window, double click on the RAM. This will give you a new window with just the RAM. Once here, click the finish button. The memory object is now added to your case and analysis can begin. Before we start the MemScript, we need to blue check the "PhysicalMemory" entry. When this is finished, you should have a window that looks similar to the one in Figure 3.
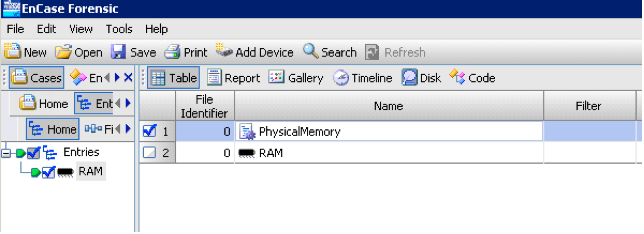
Figure 3: Blue checked PhysicalMemory entry.
With the PhysicalMemory entry blue checked start the MemScript EnScript. Figure 4 is the window that appears when the MemScript is started.

Figure 4: MemScript start page.
The first tab that appears is the Process Audit Tab. This tab will run process audits on the memory. The options available are for the ports, sections, handles and strings. These options are detailed in the Memoryze documentation and a synopses of these are in the help button. You are also able to specify either a specific process name or a specific PID. By default, the process audit is always ran when using MemScript. One tip: while running this audit is the strings option is very taxing on the size of the results. To get around this problem, it is easier to look at strings for a specific process name or PID rather than across the whole memory image. The other audits available with MemScript are Driver Audits, Driver Signature Audits, and Rootkit Audits. All of these audits are detailed in the Memoryze documentation as well. These audits can be ran along with a process audit and multiple audits can be ran and the same time. Running these audits is done by checking whether they should be performed or not. An example of selecting the Rootkit Audit to run is shown in Figure 5.
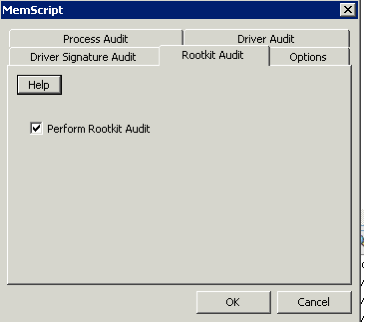
Figure 5: Example of running the Rootkit Audit.
All of the audits are stored in the case's export folder. These audits can then be viewed with Internet Explorer or Audit Viewer. If Audit Viewer is already installed on the machine, you can set up MemScript to automatically launch the Audit Viewer when the analysis is done. Setting up to launch Audit Viewer automatically is done in the Options tab. The options tab is shown in Figure 6 with MemScript configured to launch Audit Viewer when the memory analysis is finished.
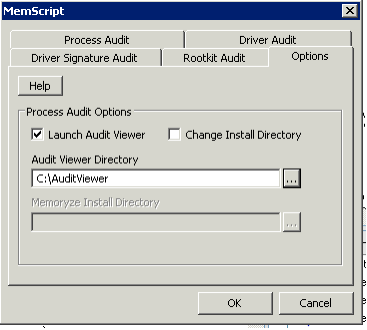
Figure 6: Setting the options to launch Audit Viewer.
The other option in MemScript is to change the install directory of Memoryze. By default MemScript looks for Memoryze in "C:Program FilesMandiantMemoryze" but it can be changed by selecting this option. Figure 7 shows the install directory being changed for MemScript.
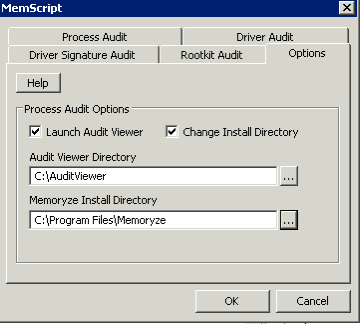
Figure 7: Changing the install directory for Memoryze.
Now that all of the options and audits have been walked through, you can start the analysis by pressing the OK button.
During the analysis a couple of command line boxes will pop up depending on the options you set. If you set the option to launch the Audit Viewer, you will have two command boxes pop up, but only one command box pops up if Audit Viewer is not set to launch. The first command box to pop up is Memoryze running its analysis. Please leave this command box open, it should close when Memoryze's analysis is done. Since the Audit Viewer is also launched from a command shell, the next box to open will also need to be kept open until you are done looking at the results with Audit Viewer.
When the analysis is done the results will be populated in the Audit Viewer. Figure 8 below shows the result of running a Process Audit and Driver Signature Audit.
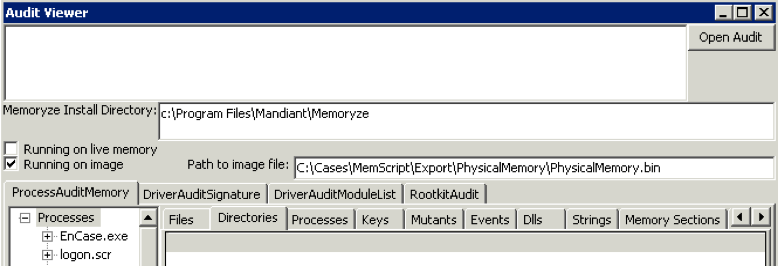
Figure 8: Results of MemScript in Audit Viewer.
The results of the Process Audit are shown in the ProcessAuditMemory tab. The Driver Signature Audit results will be displayed in the DriverAuditSignature tab. Another nice feature of using MemScript is that when the Audit Viewer is launched you can acquire processes from the memory image you are analyzing. The memory image file is exported to your case's export folder and populated in the Audit Viewer.
